


The MACD indicator is a powerful trading tool that can help traders catch on to the direction of price trends with just a bit of understanding. And once you know how to use it, you will spot market trends like a pro in no time. This guide will break down the definition of the MACD indicator, how it works, and how you can leverage it to make better trading decisions. Let’s check it out!
Understanding the MACD Indicator
First, we will dive into some basics about the MACD indicator, including its definition and how it works.
What is the MACD Indicator?
The MACD tool is a powerful indicator that many traders use to track the direction of prices and momentum shifts in the market. It does this by comparing two moving averages, usually one that reacts quicker to new price data and another that moves more slowly. The faster average represents shorter-term trends, while the slower average reflects longer-term trends.
Seeing how these two averages interact over time provides MACD users with simple signals about whether an uptick or downtick in an asset’s value is likely to continue or may potentially reverse, according to the momentum measured by this indicator.
Read more: MACD Trading Strategy: A Simple Guide for Beginners
How the MACD Indicator Works?
The MACD is made by subtracting a 26-period moving average line from a 12-period one. Both averages give more importance to newer numbers than older ones, helping track current trend changes.
The MACD indicator provides helpful information to traders in a simple way. Here’s how it works:
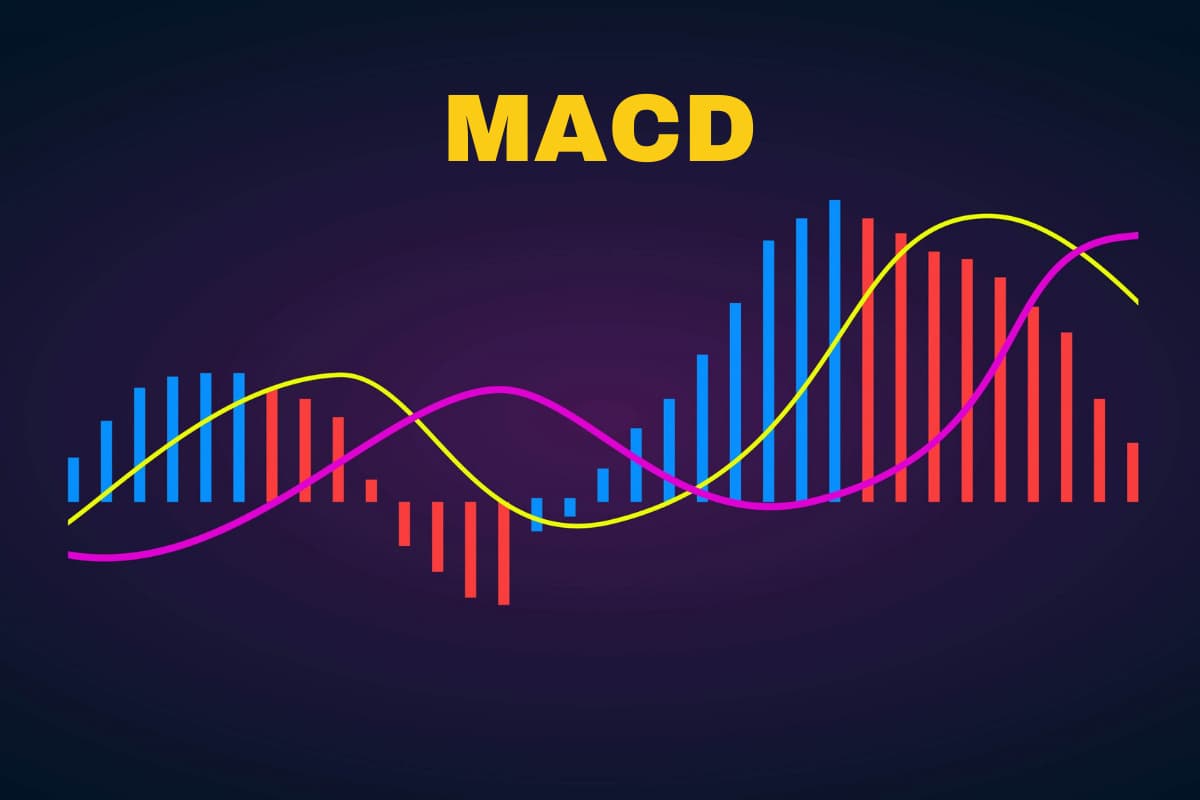
- The MACD Line illustrates the difference between a faster-moving average (like 12 days) and a slower one (such as 26 days). This alerts when shorter and longer trends may differ.
- The Signal Line is a moving average of the MACD line itself, smoothing out its ups and downs over 9 days.
- The Histogram displays the gap between the MACD and Signal lines with its colored bars. This makes it clear when they are converging or diverging from each other.
Taking all parts together allows MACD users to spot signs of rising or falling momentum that could point to changes in the direction of prices.
Pros and Cons of the MACD Indicator
Now let’s take a look at the advantages and disadvantages of utilizing the MACD indicator:
Pros
- Easy to utilize and interpret: It is simple to understand and follow, with clear signals like line crosses and colored bars that even beginners can readily grasp.
- Works across various financial markets: Whether day trading stocks, currency pairs, or cryptos, the MACD can provide helpful insights no matter the market or period examined.
- Helps spot trend reversals: Spotting divergences allows the MACD to sometimes identify potentially incoming shifts in trends at an early stage.
- Combines momentum and trend detection: By taking both momentum and direction into account together, the MACD offers a well-rounded view that detects swings in how strongly or weakly prices are moving in their current trend.

These useful aspects contribute to the MACD remaining a go-to tool for many traders seeking to gain clearer views on market shifts.
Cons
- Lagging indicator: Because it follows past price movements, the MACD can sometimes signal trends after they have begun, causing a trader to miss early parts of a move or enter late.
- False signals in the sideway markets: When prices are moving sideways in choppy and unpredictable ways, the MACD may give confusing crossover signals that do not result in clear progression. This may result in unnecessary trades.
- Needs to be utilized with other indicators: Relying only on MACD signals without confirming with other tools like support levels or volume can be risky, as with any single indicator.
Taking these potential limitations into account can help traders use the MACD successfully as part of a broader strategy.
Should You Use the MACD Indicator?
While the MACD can provide clear signals during trends, traders need to remember that it may not work as well when the market moves sideways in unpredictable ways.
To use it successfully, one could pair it with other tools, check it on various periods, and gain experience by simulating trades before risking real money. With practice and understanding of its limitations, the MACD may become a helpful guide for those seeking insight into momentum and trend direction changes.
How to Spot Trends with the MACD Indicator
The MACD gives traders a clearer look ahead, similar to using binoculars. It helps in 3 main ways: spotting potential trend changes, gauging market strength, and finding good trade entries. Let’s dive into it!

Crossover Signals
The MACD indicator can deliver clues about upcoming direction changes in prices.
- When its line rises above the signal line, it gives a bullish signal that suggests prices may be set to climb going forward, which is a prompt for traders looking to profit.
- Likewise, if the MACD line falls below the signal line, that bearish signal could mean prices are ready to drop soon, which careful traders may then take as a cue to potentially sell or avoid buys.
Histogram Signals
The MACD’s histogram offers clues through its bar heights.
- Rising bars signal that a current trend’s momentum could be intensifying. Traders watch for taller bars as a confirmation that prices may keep climbing.
- Shorter bars hint that upward or downward moves may slow. Prudent traders see falling bars as a chance the trend is losing grip before a possible change in direction up ahead.
Divergence Signals
The MACD also provides clues about pending trend shifts when its movements contradict the recent direction of prices.
- A bearish divergence occurs when prices make new highs while the indicator creates lower highs – a possible sign the uptrend may soon change to a down move.
- A bullish divergence is spottable when the MACD forms higher lows despite falling prices, which can foreshadow an upturn in the future trend direction.
Pro Tips for Utilizing the MACD Indicator

Here are several handy tips for using the MACD indicator:
- Combine the MACD with other indicators like support/resistance lines to confirm signals.
- Test the MACD on different timeframes, from shorter frames that give frequent alerts to longer frames that provide stronger confirmations.
- Get experience with the indicator by practicing simulated trading with a demo account before risking real funds.
- Learn to spot variations like bullish/bearish divergences that warn of possible trend changes.
- Pay attention to both line crosses and histogram shape changes for a fuller picture of changing momentum.
- Review historical MACD signals to build confidence in knowing how it typically performs in trends versus range-bound markets.
Considering these pro strategies may help any trader implement the MACD more smoothly in a balanced approach.
Final Thoughts
To sum up, the MACD indicator can be a powerful tool for spotting trends and changes in market momentum when used properly. By understanding how to read its crossover signals, histogram bars, and divergences, traders gain valuable clues about upcoming price movements. The MACD works best not in isolation but combined with other complementary indicators. With study and practice, it can become a trusted part of any trader’s approach. For more useful tips, please visit https://ru.wemastertrade.com/blog/. Join WeCopyTrade for pro trading strategies.