


Are you ready to elevate your trading experience? Discover the power of MT4 charting tools that provide you with unparalleled insights into market trends and price movements. Whether you’re a beginner or an experienced trader, mastering these tools can significantly improve your trading results. Don’t miss out, start leveraging MT4 charting tools today and unlock your trading potential!
What is MT4?
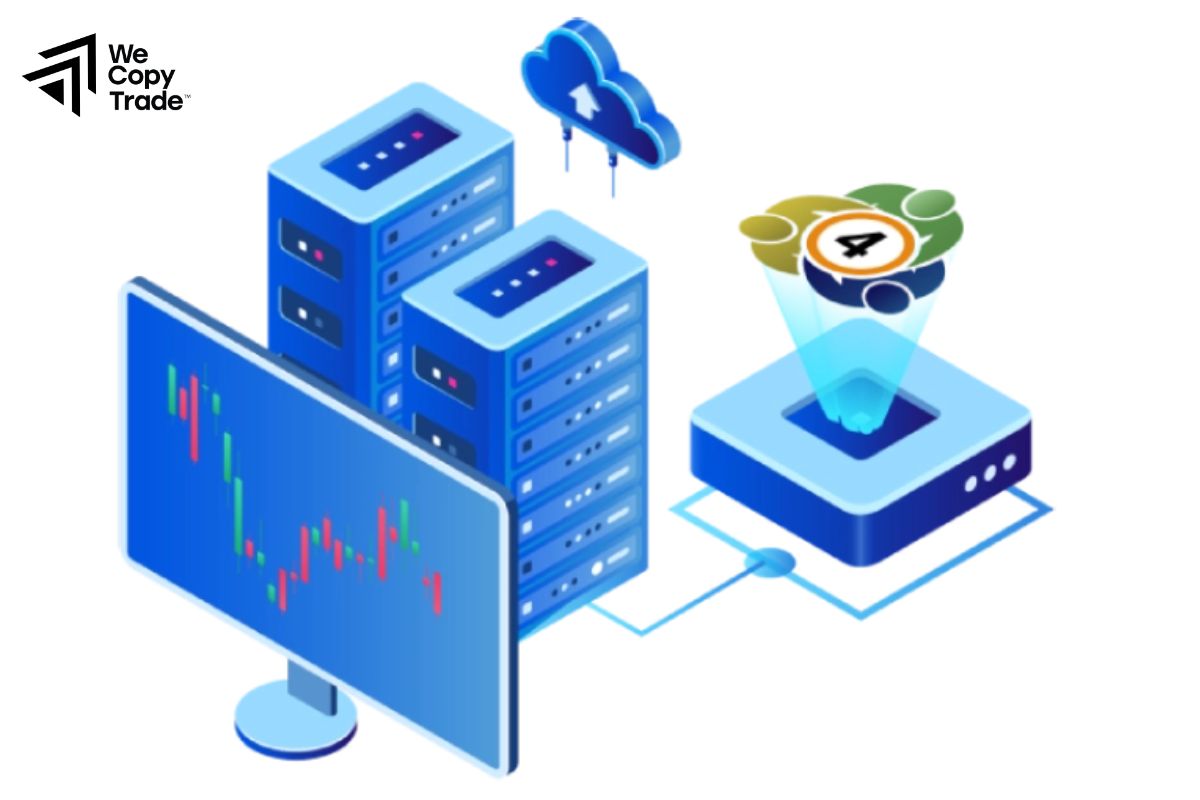
MetaTrader 4 (MT4) is a widely used trading platform designed primarily for online trading in the foreign exchange (Forex) market, but it also supports trading in commodities, cryptocurrencies, and other financial instruments.
Developed by MetaQuotes Software in 2005, MT4 has gained immense popularity among traders due to its user-friendly interface, robust functionality, and advanced charting capabilities.
See now:
- What is the difference between MT4 vs MT5 trading platform
- Discover the top 12 popular and effective MT4 indicators
- MT4 Account Types – Which is Better for Forex Trading?
How to read charts in Forex
Reading charts in Forex is essential for understanding price movements and making informed trading decisions. Here’s a step-by-step guide to help you interpret Forex charts effectively:
Understand the Chart Types
- Line Chart: Displays closing prices over time. It’s simple and useful for identifying general trends.
- Bar Chart: Shows open, high, low, and close (OHLC) prices for each time period. Each bar represents the price movement within that period.
- Candlestick Chart: Similar to bar charts, candlestick charts visually represent price movements with color-coded “candles” indicating bullish (closing price higher than opening price) or bearish (closing price lower than opening price) trends.
Identify the Time Frame
- Forex charts can be viewed in various time frames (e.g., 1 minute, 5 minutes, 1 hour, daily, weekly). Choose a time frame based on your trading style:
- Scalping: Short time frames (1M, 5M)
- Day Trading: Medium time frames (15M, 1H)
- Swing Trading: Longer time frames (4H, Daily)
Analyze Price Movements
- Look for patterns in the price movement, including:
- Trends: Uptrend (higher highs and higher lows), downtrend (lower highs and lower lows), or sideways trend (price moving within a range).
- Support and Resistance Levels: Horizontal lines indicating where prices have historically had a hard time moving above (resistance) or below (support).
Use Technical Indicators
- Incorporate indicators to enhance your analysis:
- Moving Averages: Identify trends by smoothing out price data.
- RSI (Relative Strength Index): Indicates overbought or oversold conditions.
- MACD (Moving Average Convergence Divergence): Shows momentum and potential trend reversals.
Look for Chart Patterns
- Recognize common chart patterns that can signal future price movements:
- Head and Shoulders: Indicates a potential reversal.
- Triangles: Can signal continuation or reversal depending on the breakout direction.
- Double Tops and Bottoms: Indicate potential reversals.
Combine Fundamental Analysis
- While technical analysis is crucial, it’s also important to consider fundamental factors that can affect currency prices, such as economic indicators, geopolitical events, and central bank policies.
How to open a MT4 charting tools
Opening MT4 charting tools is straightforward. Here’s a step-by-step guide to help you get started:
Step 1: Launch MT4
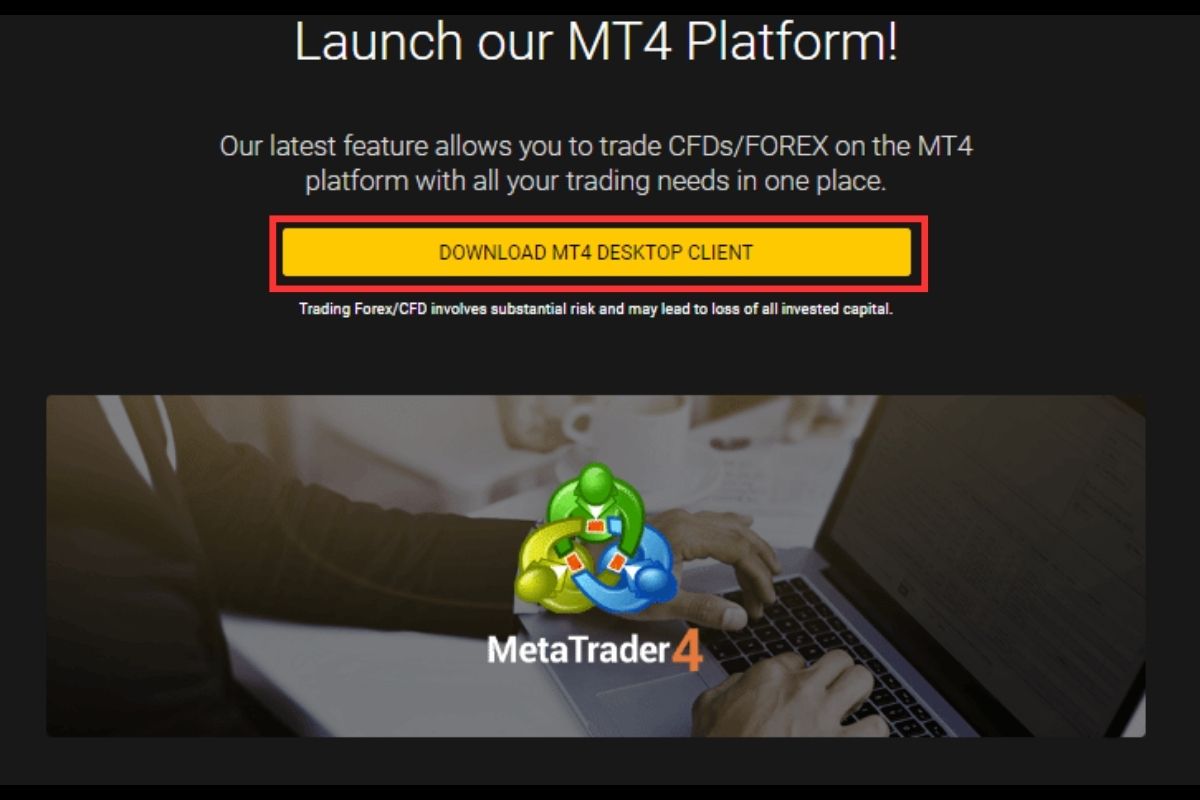
- Open the MetaTrader 4 application on your computer.
Step 2: Select a Trading Instrument
- Market Watch Window: If the Market Watch window is not visible, go to View > Market Watch or press Ctrl + M to open it.
- In the Market Watch window, you’ll see a list of available trading instruments (currency pairs, commodities, indices, etc.).
Step 3: Open a Chart
Right-click Method:
- Right-click on the instrument you want to chart.
- Select Chart Window from the context menu.
Drag-and-Drop Method:
- Click and drag the instrument from the Market Watch window to the chart area. This will automatically open a new chart for that instrument.
Menu Method:
- Click on File in the top menu.
- Select New Chart.
- Choose the instrument you want from the list, and click OK.
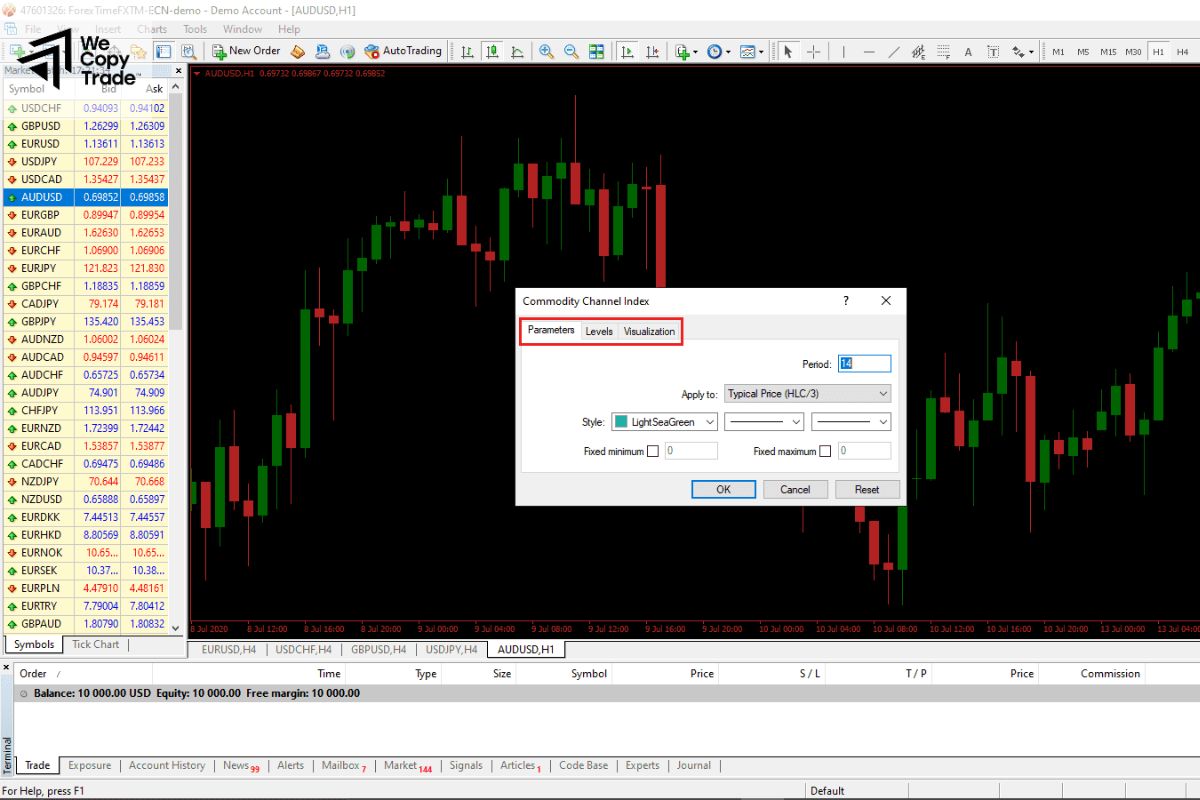
Step 4: Customize the Chart
- Adjust Time Frame: To change the time frame, look at the toolbar above the chart. You can select from options such as M1 (1 minute), M5 (5 minutes), H1 (1 hour), D1 (daily), etc.
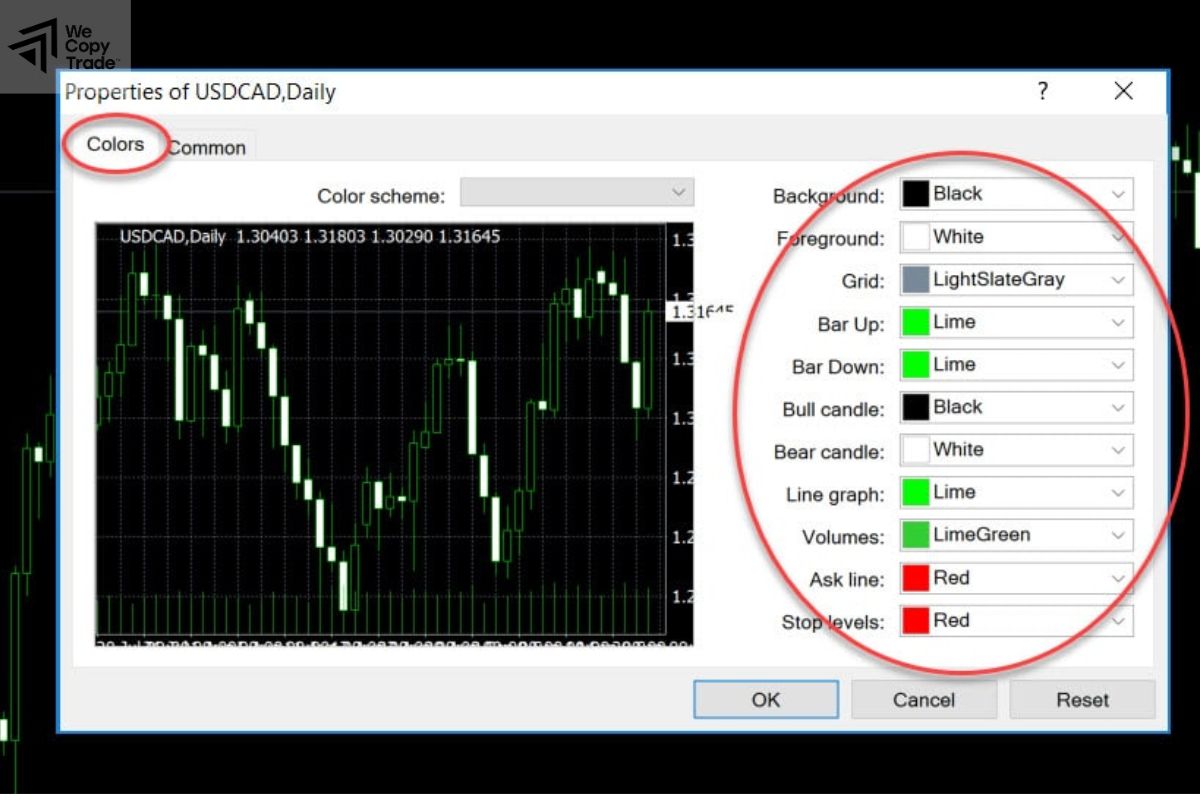
- Change Chart Type: Right-click on the chart, select Chart Type, and choose between Line, Bar, or Candlestick charts.
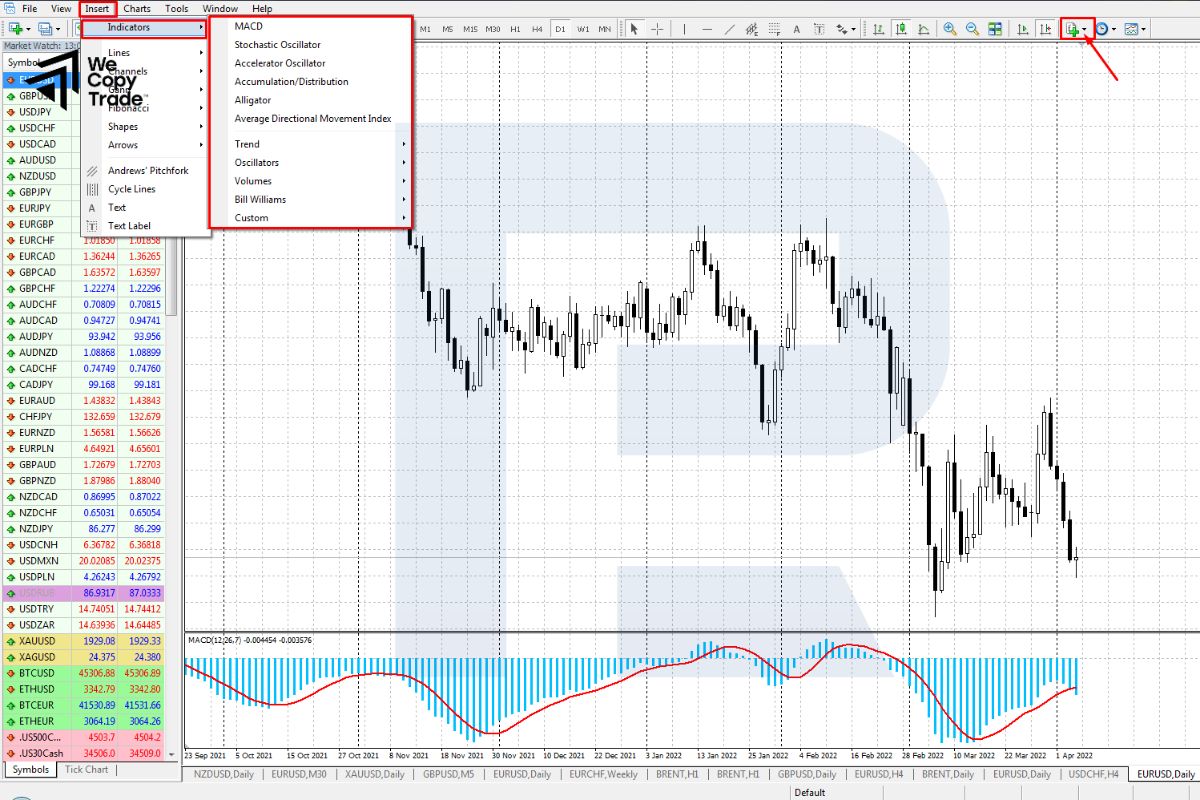
- Add Indicators: To apply technical indicators, go to the Insert menu, select Indicators, and choose the indicator you want to add to the chart.
Step 5: Save Your Chart Setup
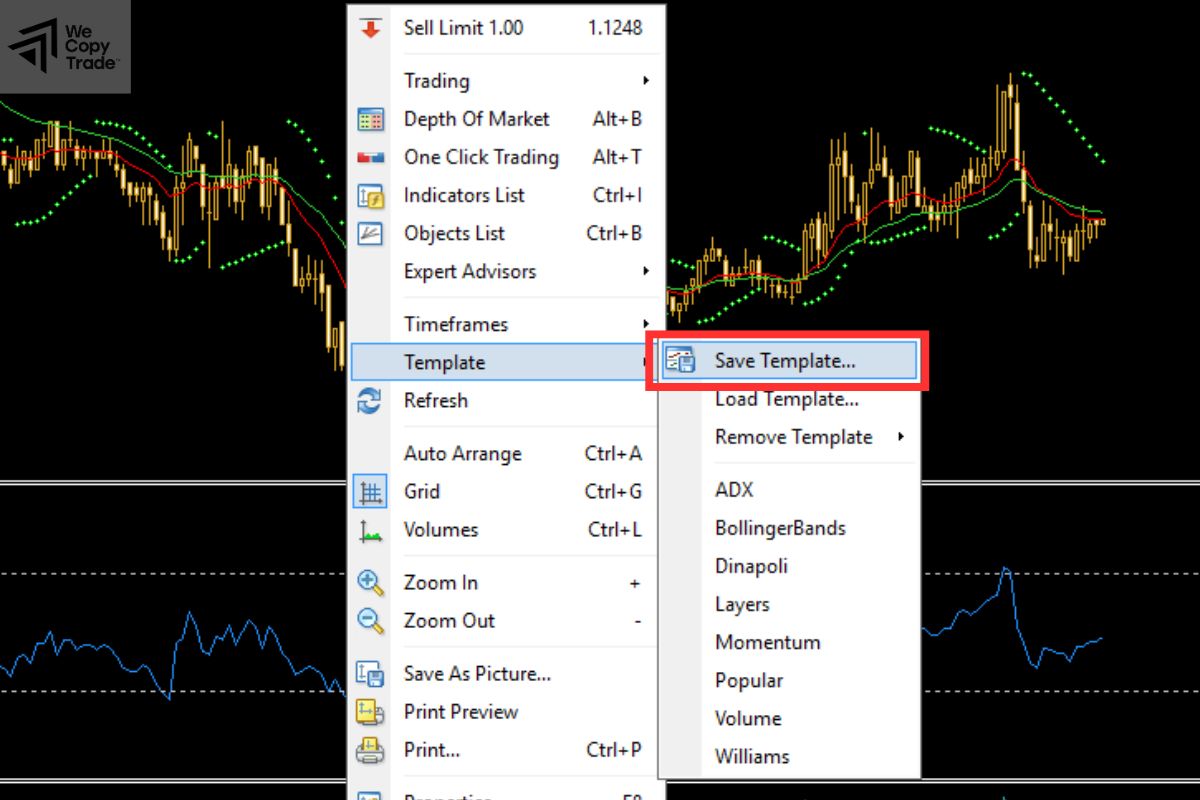
- Once you have customized your chart, you can save your layout. Go to File > Save As Template, give it a name, and click Save. You can later load this template for other charts.
What types of MT4 charting tools are there?
MetaTrader 4 (MT4) offers a variety of charting tools that can help traders analyze market data, identify trends, and make informed trading decisions. Here are the main types of MT4 charting tools:
Line Chart
The line chart connects the closing price points of each time period, forming a continuous line.
Advantages:
- Easy to understand and simple, suitable for beginners.
- Quickly helps identify the overall market trend.
Disadvantages:
- Does not provide information about the opening, high, and low prices, which may lack some important data for detailed analysis.
Bar Chart
Each bar represents the opening, high, low, and closing prices (OHLC) within a specific time period.
- The top of the bar shows the highest price, while the bottom shows the lowest price.
- The horizontal line on the left indicates the opening price, and the horizontal line on the right indicates the closing price.
Advantages:
- Provides more detailed information about prices compared to the line chart.
- Helps effectively determine entry and exit points by analyzing price fluctuations.
Disadvantages:
- Can be harder to understand for beginners compared to the line chart.
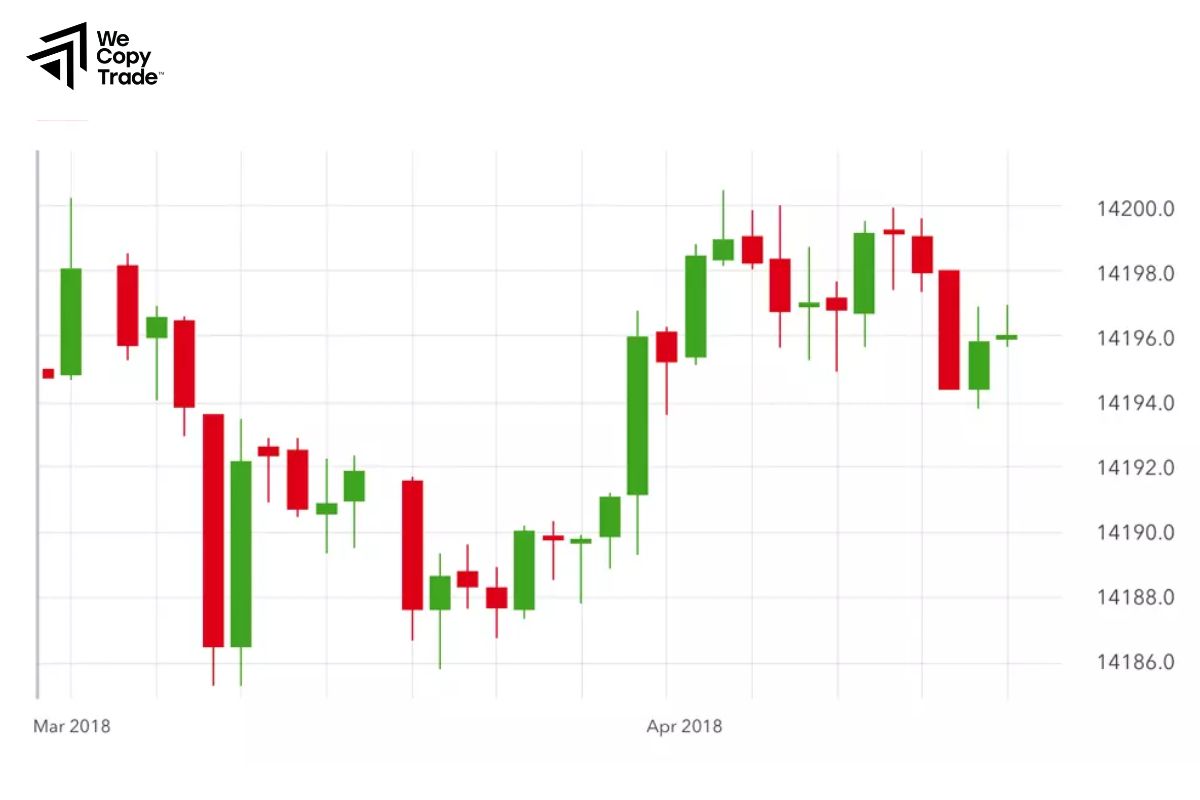
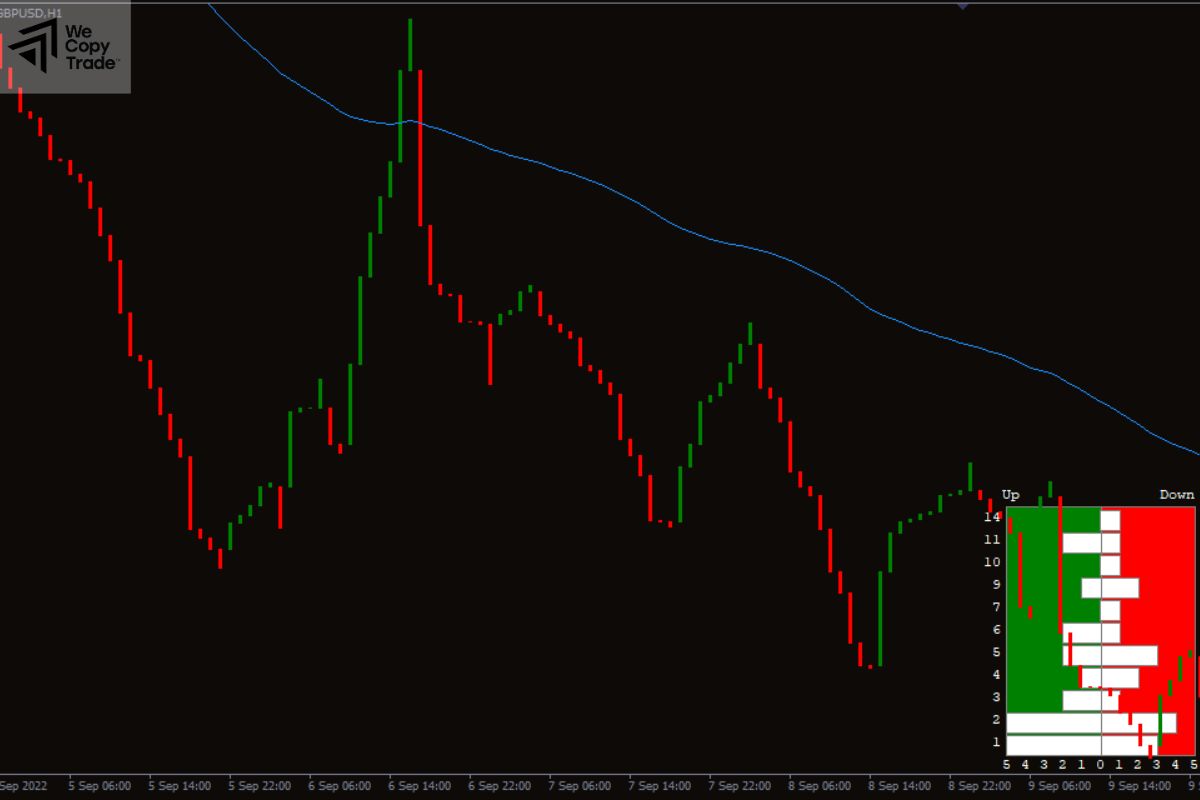
Candlestick Chart
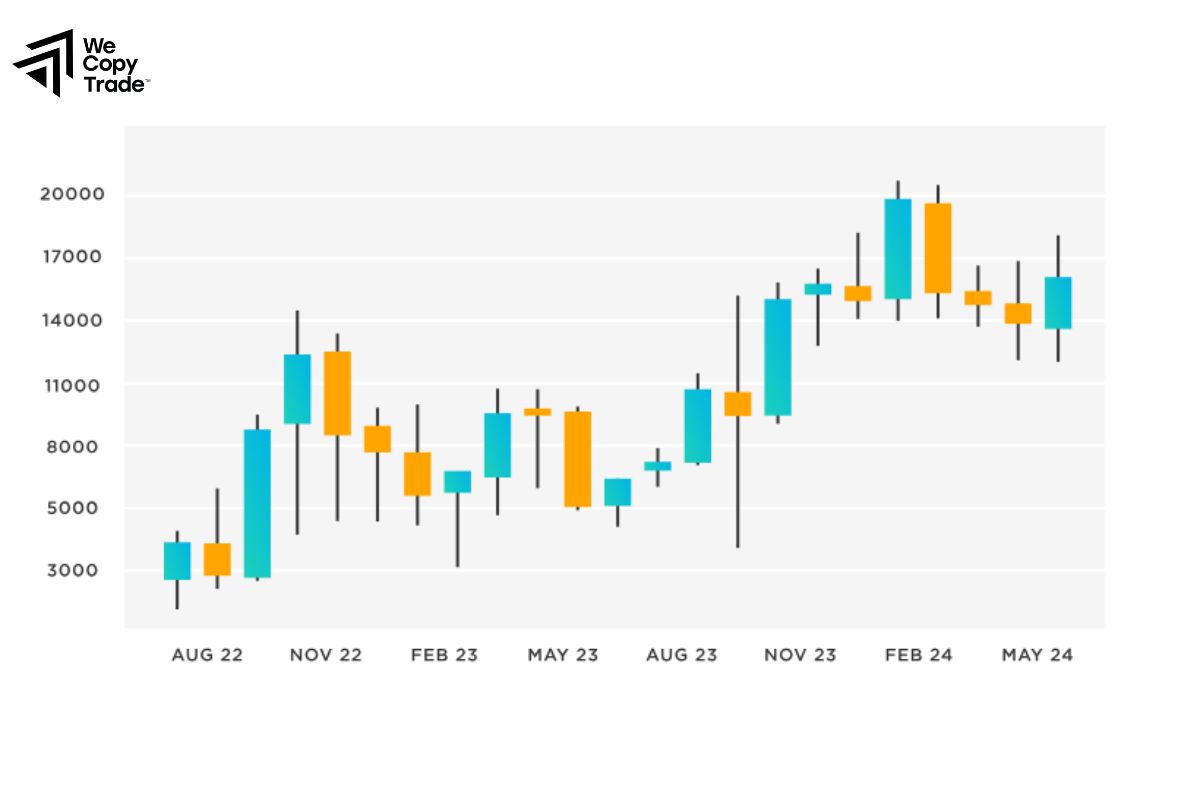
Similar to the bar chart, but each “candle” represents a specific time period with clear components:
- Body of the Candle: Represents the range between the opening and closing prices.
- Wicks of the Candle: Show the highest and lowest levels during that time period.
- Candles have different colors indicating price increases (green candle) or decreases (red candle).
Advantages:
- Provides visual and easily understandable information about price fluctuations.
- Candle patterns can indicate strong trading signals, helping to predict trend changes.
Disadvantages:
- Can be confusing if one does not understand candle patterns and how to read them.
Some frequently asked questions when using MT4 charting tools
Here are some frequently asked questions (FAQs) regarding the use of MT4 charting tools:
Can I save my chart settings?
Yes, you can save your chart settings as a template. Right-click on the chart, select Template, and then choose Save Template. You can load this template later on other charts.
How do I change the time frame of a chart?
To change the time frame, look at the toolbar above the chart. You can select from various options like M1, M5, H1, D1, etc. Alternatively, right-click on the chart, go to Timeframes, and choose your desired time frame.
Can I use multiple charts at once in MT4?
Yes, you can open multiple charts simultaneously. You can either open a new chart window for each instrument or use the Tile Windows option under the Window menu to arrange them on your screen.
How do I switch between different chart types?
To switch between chart types, right-click on the chart, select Chart Type, and choose from Line, Bar, or Candlestick charts. You can also use the toolbar buttons for quick switching.
Conclusion
In conclusion, mastering MT4 charting tools is essential for traders looking to enhance their market analysis and trading strategies. Whether you are looking to improve your technical analysis skills or streamline your trading process, exploring the full potential of MT4 charting tools will undoubtedly help you succeed in the dynamic world of Forex trading. Start leveraging these powerful features today to elevate your trading experience!