


When it comes to trading stock or cryptocurrency markets, one of the biggest challenges is figuring out the right time to enter or exit a transaction. That is where technical indicators come into play and the RSI trading strategy is one of the most prevalent. RSI (or Relative Strength Index) is a simple yet powerful technical tool that helps you spot trends and identify when an asset might be overbought or oversold. This article will break things down into easy steps to help you efficiently use the RSI trading strategy.
What is the RSI Trading Strategy?
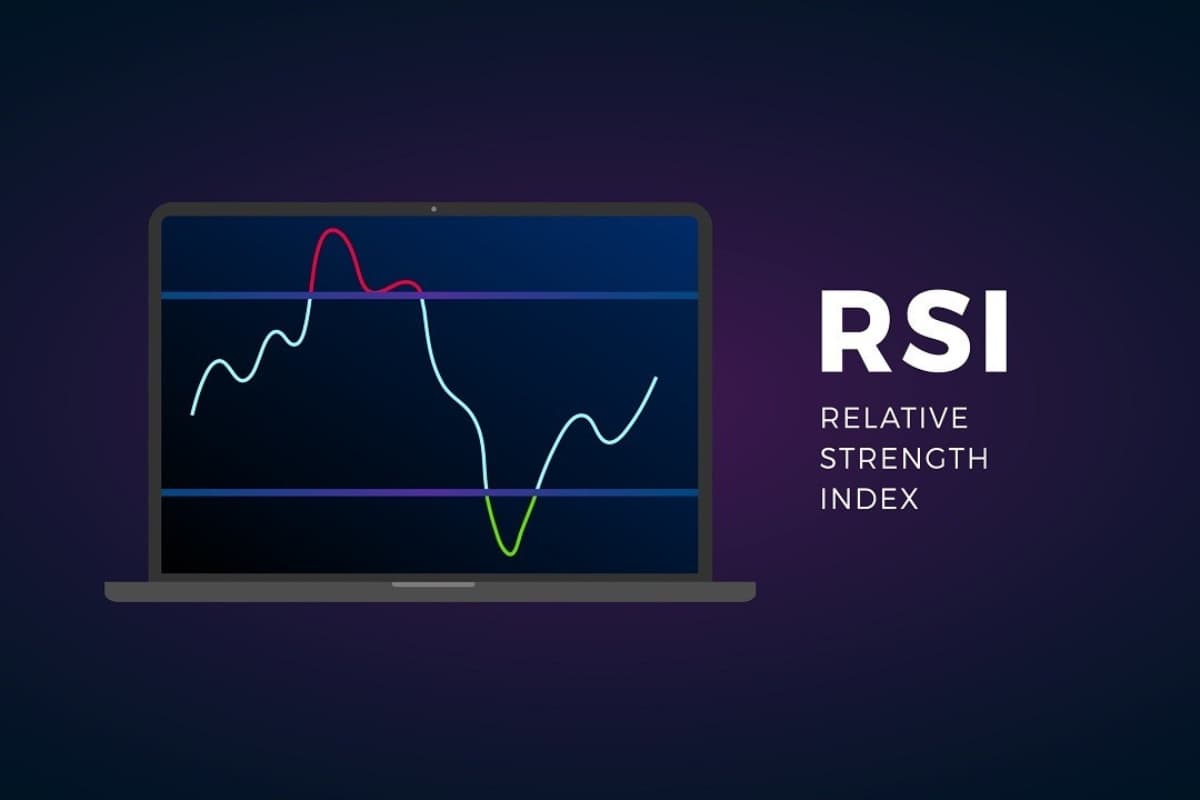
RSI (Relative Strength Index) shows if something like a stock, cryptocurrency, or currency pair is overbought or oversold. Think of it like a weather forecast, it warns if a price change storm might be coming.
The RSI looks like a line on a chart from 0 to 100. Here is what those numbers suggest:
- Above 70: The asset may be overbought, meaning it is pricey and could drop soon.
- Below 30: The asset might be oversold, suggesting it is cheap and could go up as more people buy in.
This helps the RSI trading strategy spot coming changes and trends before they switch, which can help with deciding when to trade.
How Does the RSI Trading Strategy Work?
The RSI trading strategy is all about interpreting the RSI line to spot potential purchasing or selling opportunities. Here is how it typically operates:
Look for Overbought Conditions (Above 70)
When RSI hits over 70, it can mean that the asset was bought too eagerly. Often that suggests the cost will drop as traders start selling for profits. This situation provides a chance to sell what you own.
Watch for Oversold Conditions (Below 30)
If the RSI dips under 30, it suggests it was sold off too heavily and could be a bargain. Then purchasers may drive the price back up. That opens a potential opportunity to buy and ride the rising trend.
Spot Trend Reversals
Sometimes, the RSI is between 30 and 70 and the line can either rise or fall. In these cases, you will watch for the opposite movement – divergence. For instance:
- If cost is increasing but the RSI is decreasing, the trend could be losing steam and a reversal (a price drop) may happen soon.
- If the cost is falling but the RSI is climbing, the downward trend may be weakening, signaling an upcoming price boost.

Steps to Use the RSI Trading Strategy Effectively
Now that you know what the RSI measures and how it works, let us dig into the essential steps to apply the RSI trading strategy:
Step 1: Open your Charting Tool
First, you will need a charting tool that offers the RSI indicator. Many prestigious trading platforms, like WeCopyTrade, have RSI available by default. Simply open the chart for the asset you want to analyze and add the RSI indicator.
Step 2: Set the RSI Timeframes
Most use the RSI looking at 14 time periods, whether 14 days, hours, or minutes depending on the chart. This setup works well for many traders, but some change it to fit their style. For example:
- Traders making quick trades (short-term traders) may prefer an RSI of 9 or 7 to notice price shifts more rapidly.
- Traders making long traders (long-term traders) may opt for an RSI of 21 to filter out smaller bumps and concentrate on bigger trends instead.
Step 3: Identify Key RSI Levels
With the RSI added to your chart, keep an eye on the key levels of 70 and 30.
- If the RSI rises above 70, you should think about selling soon or waiting for a dip.
- When the RSI sinks under 30, it could be a decent chance to buy or look for the trend-changing direction at least.
Step 4: Confirm the Signal with Price Action
Using the RSI trading strategy goes best when paired with other tools and indicators. Check the price patterns – how the price moves over time. Is there a clear trend, or is the market wobbly or flat? RSI hints work better when trends are strong than when they are iffy or unchanged.
For instance, if the cost is rising long-term but RSI dips under 30, that could be a great chance to buy. Yet if the cost is dropping and RSI climbs over 70, it may be smart to sell what you own or not buy more.
Step 5: Utilize Stop-Loss Orders for Safety

No strategy works perfectly, including utilizing the RSI. To help reduce risk, always set stop-loss orders. They automatically sell your holdings if the cost moves against you. For example:
- If you purchase when the RSI sinks under 30, set your stop under the recent bottom price.
- If you sell as the RSI climbs over 70, put your stop a tad above the recent top price.
How to Trade Utilizing RSI and Other Indicators
Combining RSI with the following indicators helps make your market analysis stronger and more clear on potential trade opportunities.
- Moving Averages (MA): Simple or exponential lines placed over price action provide guidance on the prevailing tendencies.
- Bollinger Bands: These lines enclose typical price range signals when assets edge towards overextension.
- MACD: This marker plots moving average differences to identify whether momentum strengthens or weakens.
- Stochastic Oscillator: This sign tracks an asset’s close price versus its high-low ambit to gauge overbought/oversold levels.
- Fibonacci Retracements: These trend-based lines assist in estimating common pullback distances for entries anticipating continuation.
Tips for Utilizing the RSI Trading Strategy Successfully
Tips for using the RSI trading strategy successfully
Here are some handy tips for using the RSI trading strategy successfully:
- Do not rely only on RSI: also check other indicators and what you think will happen. RSI alone will not catch everything.
- Have a good plan and do not leave it: Figure out your entry, exit, and limit for losses first before trading. Adhere to your preset trading strategy no matter what happens.
- Modify settings based on timeframe: What works on a daily may not on 5 minutes. Utilize shorter RSI periods for quick transactions and longer for more extended trades.
- Practice with play money first: Try out your strategy on a practice account with fake money before using real cash.
- Be patient and wait for clear signs: RSI strategies are not get-rich-quick, it takes time to learn. Do not force trades unless you see a real signal.
- Review results often and make adjustments as needed to your strategy over time. No approach is perfect without refinement.
- RSI works best in strongly trending markets, not choppy or flat periods. Look for divergences like price falling with rising RSI.
- Use stop-losses to manage risk on every trade. For instance, set a stop below recent lows on a long or above highs on a short.
Final Words
In conclusion, paying attention to the RSI can help traders spot changes in market trends. The RSI trading strategy gives a trader a tool to help see when might be good times to buy low and sell high. While it takes practice, following how the RSI levels move compared to price can provide clues to help trade with the trends. It is best not to rely solely on RSI, but to use it along with other research. By experimenting on paper before risking real money, the RSI strategy has the potential to help investors identify opportunities in the market. Visit https://ru.wemastertrade.com/blog/ for more helpful trading tips.